Just because speed isn’t always obvious, you can still prove the other driver was going too fast by collecting objective evidence: skid marks, vehicle damage patterns, surveillance or dashcam video, witness statements, police reports and electronic data from airbags/ECU or GPS. You should document the scene with photos, preserve digital evidence, and consult an accident reconstruction expert to convert measurements into a defensible speed estimate for insurance or court.
Key Takeaways:
- Preserve and document physical evidence at the scene – skid marks, gouge marks, debris pattern, vehicle damage and final rest positions provide measurable clues to speed.
- Obtain electronic data sources – vehicle event data recorder (EDR), GPS/dashcam footage, traffic or surveillance cameras, and phone telemetry can give objective speed or time-distance information.
- Use expert accident reconstruction – a reconstructionist applies physics, crush analysis, and software models to convert evidence into a pre-impact speed estimate admissible in court.
- Secure official and witness records quickly – police reports, radar/lidar readings, and eyewitness statements should be preserved and obtained early to avoid loss or degradation of evidence.
- Account for context and conditions – posted speed limits, sight lines, road grade, weather, and vehicle type affect speed estimates and responsibility determinations.
Understanding Speed Limits
Posted limits set the legal ceiling on a road-residential streets often 25 mph, school zones 15-20 mph and interstates 65-75 mph-while many jurisdictions also enforce a “basic speed” rule requiring speeds safe for conditions. You should factor that NHTSA data links speeding to roughly a quarter of U.S. traffic fatalities, so limits guide both legal liability and safety analyses when you’re proving another driver exceeded a safe rate of travel.
The Importance of Speed Limits
Speed limits reduce collision energy and give you stopping margin: kinetic energy grows with the square of velocity, so doubling speed produces four times the impact energy. You’ll see stopping distance and injury severity rise rapidly as speed climbs, which is why a 10-20 mph excess can change a fender‑bender into a fatal crash. Courts and reconstruction experts weigh those nonlinear effects when assessing fault and damages.
Common Misconceptions About Speeding
You might think small excesses are harmless, but even 5-10 mph can materially increase stopping distance and impact force. Many drivers justify speeding because “everyone else is doing it” or to save time, yet going 65 vs 60 mph on a 60‑mile trip only saves about 4.6 minutes while substantially raising risk. Legal defenses based on peer behavior or minor overages are weak without supporting evidence.
Technical myths also persist: radar and LIDAR can be affected by calibration, patrol‑car movement and the cosine error if the beam isn’t head‑on, and your car’s speedometer may not read perfectly true. You can estimate speed from skid marks using v ≈ √(30·f·d) (v in mph, d in feet, f≈0.6-0.8); for d=100 ft and f=0.7 you get about 46 mph. Expert reconstruction ties these measurements to the case.
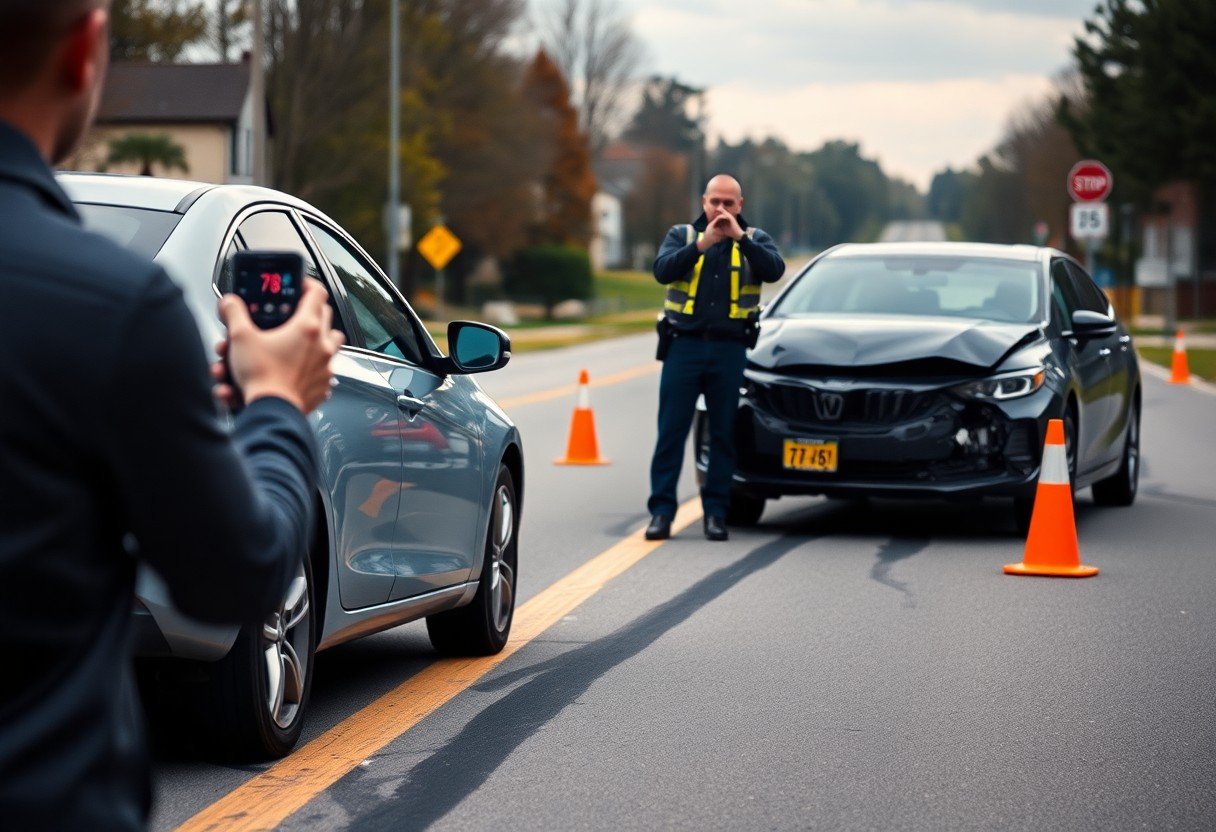
Analyzing the Accident Scene
At the scene you document precise measurements, photos, and witness statements to lock down physical facts. Use a tape or laser to record skid lengths in feet, mark final rest positions, note road grade and weather, and photograph all evidence with a scale. Retrieve nearby surveillance or dashcam clips and log timestamps; these items let you and an expert correlate vehicle behavior with physical traces to estimate speed and verify accounts.
Collecting Evidence at the Scene
You should photograph 360° with a measuring scale, measure distances between tire marks, debris, and vehicle positions, and preserve perishables like paint transfers. Get names and contact info for witnesses and first responders, note lighting and timestamps, and secure traffic-cam or smartphone footage (many cameras record 30 fps). Place evidence markers and record surface samples when possible so laboratory friction testing can use matched materials.
Role of Skid Marks and Road Conditions
Skid-mark length and surface friction give a direct speed estimate using v ≈ √(30·μ·d) (mph), where μ is the coefficient and d is skid length in feet; for example, a 120‑ft skid on dry asphalt (μ≈0.7) yields about 50 mph. You also must note whether marks are straight skids, yaw marks, or ABS-impressed gaps, since marking type changes the analysis method.
Further study involves measuring mark start points, gap patterns, and any gouge marks to locate initial brake application or impact. You test surface friction-typical μ values: dry asphalt ≈0.7, wet ≈0.4, icy ≈0.2-and document grade (percent slope) because a 5% downhill grade can noticeably increase stopping distance. Event Data Recorder (EDR) downloads, video frame-rate calibration, and tire/ABS evidence let you refine raw skid-based speeds into court-ready estimates.
Utilizing Traffic Laws and Regulations
You should leverage state vehicle codes, municipal ordinances, engineering speed studies, and the MUTCD to show the other driver violated speed regulations; for example, an engineering study showing an 85th-percentile speed of 40 mph where the posted limit is 30 mph supports that their speed exceeded the legal and safe threshold and strengthens your claim.
Traffic Citations and Their Impact
A speeding citation or conviction creates a formal record you can introduce as evidence: a ticket showing the driver was 15 mph over the limit provides concrete proof, while license points, fines, or reckless-driving charges increase civil liability and bargaining power during settlement negotiations.
Understanding Local Speed Laws
Local speed laws differ: many jurisdictions enforce a basic-speed rule alongside posted limits, some use prima facie speed limits, and statutory defaults often set 25 mph in residential areas or 20 mph in school zones when signs are active, so you must review municipal code and state statutes to know which standard applies.
Speed limits are frequently established by traffic engineering studies using the 85th-percentile method; you can obtain those DOT studies, challenge limits lacking engineering justification, and introduce outdated or absent studies in depositions, motions, or to pressure insurers during settlement talks.
Witness Testimonies
Witness statements often bridge physical evidence and timeline details, so you should gather accounts from drivers, passengers, pedestrians, and nearby business employees. A consistent set of reports-for example, three independent witnesses describing speeds of 55-65 mph in a 35 mph zone-carries weight when paired with skid marks, dashcam clips, or 911 timestamps. Note where each witness stood, lighting conditions, and any audible cues like horn or tire screeching to strengthen the narrative.
The Value of Eyewitness Accounts
Eyewitnesses can provide vantage-point specifics that instruments miss, such as direction, posture, or braking behavior; jurors often find such details persuasive. You should probe distance (10-100 feet), lighting, obstruction, and whether the witness was stationary or moving. Expect speed estimates to vary-commonly by 10-20 mph-so corroboration with physical evidence or video footage increases reliability and credibility in court.
How to Obtain and Present Witness Statements
Secure full contact details, exact quotes, and a signed written statement within 24-72 hours while memory is fresh, and photograph the witness’s vantage point. You should request any phone video and note timestamps, then preserve originals for chain-of-custody. Convert raw testimony into dated affidavits or sworn statements for police and counsel, and plan demonstrative exhibits that align witness locations with measured distances and speeds.
When preparing presentation, obtain notarized affidavits or schedule depositions to lock testimony; you should also prepare witnesses for cross-examination by rehearsing concise answers and avoiding speculation. Create scaled exhibits-aerial images with measured sightlines, distance markers, and arrows showing vehicle paths-and link each witness quote to a specific exhibit panel so judges and jurors can visually match human observation to objective metrics.
Expert Opinions and Accident Reconstruction
Experts synthesize EDR outputs, skid‑mark measurements, CCTV frame counts and GPS logs to pin down speed; you can review methods at How To Prove the Speeding Driver Caused the Collision. EDRs commonly sample at 10-100 Hz and, combined with skid‑length formulas (v ≈ sqrt(30·f·d)), let you and the reconstructionist narrow pre‑impact speed estimates to within a few miles per hour.
Role of Accident Reconstruction Experts
Reconstructionists quantify pre‑impact speed, delta‑v and trajectories using tools like PC‑Crash and HVE; you’ll see them analyze EDR downloads, measure crush profiles, verify CCTV frame rates, test surface friction, and produce a report with uncertainty ranges (often ±3-5 mph) designed for admissible testimony.
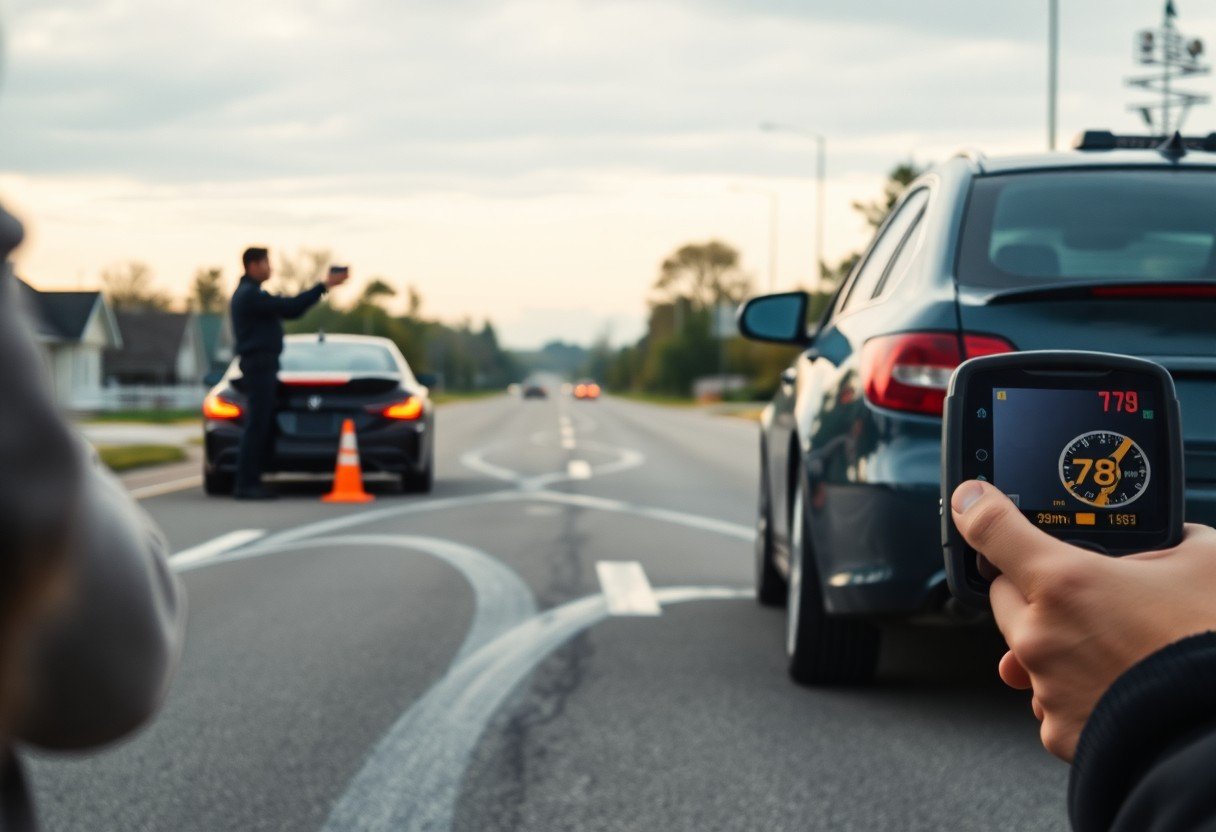
Analyzing Data from Speed Detection Devices
EDRs, radar, lidar and GPS each have strengths and limitations: EDRs log high‑rate vehicle data, radar/lidar record instantaneous returns, and GPS provides continuous tracks; you must obtain raw logs, device calibration certificates and timestamps so the reconstructionist can synchronize and validate speed evidence.
When digging deeper, request calibration sheets and raw timestamps, then align sample rates (EDR 10-100 Hz vs GPS 1 Hz) and apply filtering to remove noise; cross‑check with skid‑mark math (v ≈ sqrt(30·f·d)) – for example f=0.7 and d=120 ft yields v≈50 mph – and have the expert explain any discrepancies such as sensor error or post‑impact wheel lockup you’ll need to address in court.
Insurance Implications of Speeding
When speeding is at issue, insurers lean on police citations, vehicle damage patterns, and event data recorder (EDR) downloads to adjust liability and reserve amounts; a ticket or EDR showing 15-20+ mph over the limit often weakens your claim and can be used to assign a higher percentage of fault, which reduces both settlement value and future premium stability.
How Speeding Affects Claims and Liability
A citation or clear EDR reading shifts liability in most claims; under comparative-fault rules a 30% finding against you cuts your recovery by 30%, and insurers will cite that when negotiating. Photographs of vehicle intrusion, skid-mark measurements, and witness timing often corroborate speed estimates, so you should focus on counter-evidence like calibrated dashcam video or independent reconstructions to limit assigned fault.
Understanding Insurance Adjuster Perspectives
Adjusters prioritize objective proof that minimizes payouts, so they quickly seek police reports, prior driving history (typically covering the last 3-5 years), EDR data, and repair estimates; if you’ve got inconsistent statements or a recent speeding ticket, expect the adjuster to use that to justify a lower settlement offer or deny certain damages.
In practice, adjusters set a reserve based on initial reports and then run a cost-benefit analysis: if reconstruction or EDR shows you at, say, 45 mph in a 35 mph zone and a citation exists, they’ll argue higher comparative fault and may offer a low pre-suit settlement to avoid litigation costs. You can push back by producing contrary evidence-time-stamped video, expert reconstruction showing different speeds, or medical records tying injuries to the collision dynamics-which forces re-evaluation of their exposure and often increases settlement leverage.
Conclusion
To wrap up, if you suspect the other driver was speeding, gather and preserve evidence-photos, skid marks, witness statements, dashcam or traffic-camera footage, and the police report-and seek vehicle event-data and reconstruction experts to corroborate speed. Your prompt action, documentation, and working with an experienced attorney strengthen your claim and improve your chances of proving the other party was going too fast.
FAQ
Q: What physical evidence at the scene most reliably indicates the other driver was speeding?
A: Skid marks, yaw marks and gouge marks on the pavement show braking and loss-of-control dynamics and can be measured to estimate speed. Extent and pattern of vehicle damage, intrusion into the occupant compartment, and the final rest positions of vehicles and debris fields help reconstruct impact energy and velocity. Roadway features – curb cuts, guardrail damage, displaced signage, and point-of-impact paint transfer – also provide clues. Take high-resolution photographs from multiple angles, note distances to fixed landmarks, and record the exact locations of marks and debris; those measurements let reconstructionists convert scene evidence into speed estimates.
Q: How can vehicle data recorders (EDRs) or dashcams be used to prove excessive speed, and how do I secure that data?
A: Many modern vehicles have Event Data Recorders that capture pre‑crash speed, throttle position and braking inputs for seconds before an impact. Dashcams and infotainment GPS logs can show timestamped speeds and video of the roadway. Preserve EDR and camera data quickly: avoid deleting or overwriting logs, obtain owner consent if needed, and request data preservation from the vehicle manufacturer, dealership or camera vendor. Attorneys commonly issue preservation letters and subpoenas to secure downloads by qualified technicians; do not attempt to reset or repair the vehicle yourself, as that can overwrite evidence.
Q: Can police reports, traffic cameras and witness statements prove the other driver was speeding?
A: Yes. Police crash reports often include officer estimates, citations, and recorded speed measurements; traffic or red‑light cameras may capture vehicle speed or provide video to assess motion; and independent dashcam or surveillance footage can show passing speeds relative to fixed objects. Eyewitness accounts that describe excessive speed, racing, or failure to brake corroborate physical evidence. Preserve witness contact information, obtain signed statements when possible, and request copies of governmental camera footage promptly because many agencies retain recordings for a limited time.
Q: What does an accident reconstructionist do to estimate speed, and how reliable are those results?
A: Reconstructionists combine scene measurements, vehicle damage analysis, physics (conservation of energy and momentum), skid- and yaw-mark calculations, crush stiffness data and vehicle mass to produce speed estimates and ranges. They factor in road grade, friction coefficients, and whether ABS or electronic stability systems were active. Results include uncertainty ranges and assumptions; reliability increases with more and higher-quality data (EDR output, precise measurements, photographs, and material evidence). Courts evaluate methods, assumptions and expert qualifications when weighing reconstruction testimony.
Q: What steps should I take immediately after a speeding collision to preserve and present evidence proving the other driver was too fast?
A: Secure medical attention and a police response so an official report documents the crash. Photograph the scene, vehicle damage, skid marks, debris, road signs and the surrounding environment with timestamps or a camera that records time. Collect witness names and contact details and preserve any video on phones or cameras. Notify your insurer but avoid speaking to the other party’s carrier without counsel. If possible, get the other vehicle’s VIN and owner information and arrange preservation of EDR and surveillance footage through a lawyer or by sending preservation letters to relevant agencies. Retain all records-photos, repair estimates, medical reports, police reports and witness statements-and provide them to an attorney or reconstruction expert for analysis and presentation to insurers or a court.